聚合图组件
# 聚合图组件
------
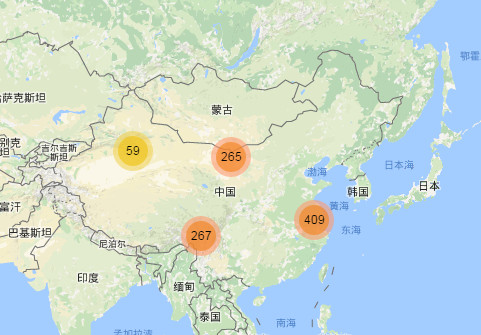
## 效果图
演示Demo(效果图如下):[http://jsrun.net/u56Kp/](http://jsrun.net/u56Kp/)
## 用法
#### 示例
```html
//创建地图,并设置初始中心点和级别
var map = L.map('map').setView([35.53222622770337, 106.875], 5);
L.tileLayer('https://api.mapbox.com/styles/v1/{id}/tiles/{z}/{x}/{y}?access_token=pk.eyJ1IjoibWFwYm94IiwiYSI6ImNpejY4NXVycTA2emYycXBndHRqcmZ3N3gifQ.rJcFIG214AriISLbB6B5aw', {
maxZoom: 18,
attribution: 'Map data © <a href="https://www.openstreetmap.org/">OpenStreetMap</a> contributors, ' +
'<a href="https://creativecommons.org/licenses/by-sa/2.0/">CC-BY-SA</a>, ' +
'Imagery © <a href="https://www.mapbox.com/">Mapbox</a>',
id: 'mapbox/streets-v11',
tileSize: 512,
zoomOffset: -1
}).addTo(map);
//创建聚合图标注组
var markers = new L.MarkerClusterGroup();
var markersList = [];
//生成固定个坐标
function populate() {
for (var i = 0; i < 1000; i++) {
var m = new L.Marker(getRandomLatLng(map));
markersList.push(m);
markers.addLayer(m);
}
return false;
}
//在屏幕范围内随机生成一个坐标
function getRandomLatLng(map) {
var bounds = map.getBounds(),
southWest = bounds.getSouthWest(),
northEast = bounds.getNorthEast(),
lngSpan = northEast.lng - southWest.lng,
latSpan = northEast.lat - southWest.lat;
return new L.LatLng(
southWest.lat + latSpan * Math.random(),
southWest.lng + lngSpan * Math.random());
}
markers.on('clusterclick', function (a) {
//console.log(a);
});
markers.on('click', function (a) {
//alert('marker ' + a.layer);
});
populate();
//将聚合图添加到地图上
map.addLayer(markers);
```
## 构造方法
| 构造方法 | 描述 |
| -------------------------- | -------- |
| L.MarkerClusterGroup(opt?) | 构造方法 |
### 构造属性
| 属性名 | 类型 | 默认值 | 描述 |
| -------------------------- | -------- | -------------------------------------------- | ---------------------------------------------------------- |
| showCoverageOnHover | boolean | true | 当鼠标经过聚合图标时,是否显示所有被聚合标注的边框范围。 |
| zoomToBoundsOnClick | boolean | true | 当点击聚合图标时,是否切换地图当前可视范围到聚合标注范围。 |
| spiderfyOnMaxZoom | boolean | true | 当地图在最大级别时,点击聚合图标是否显示所有被聚合的标注。 |
| removeOutsideVisibleBounds | boolean | true | 是否显示被聚合标注的外边框。 |
| spiderLegPolylineOptions | object | { weight: 1.5, color: '#222', opacity: 0.5 } | 当鼠标放置在聚合图标上时,显示的范围线的样式信息。 |
| iconCreateFunction | function | 无 | 用于自定义marker。 |
## 方法
| 方法名称 | 描述 |
| ------------------------------------------------------------ | ------------------------ |
| addLayer( [L.Marker](http://www.dituyi.com.cn/docs/js-api/wmap-api/Marker.html)) | 添加一个标注到聚合图层。 |
| addLayers([L.Marker](http://www.dituyi.com.cn/docs/js-api/wmap-api/Marker.html)[]) | 添加一组标注到聚合图层。 |
| removeLayer([L.Marker](http://www.dituyi.com.cn/docs/js-api/wmap-api/Marker.html)) | 从聚合图层删除一个标注。 |
| removeLayers([L.Marker](http://www.dituyi.com.cn/docs/js-api/wmap-api/Marker.html)[]) | 从聚合图层删除一组标注。 |
| clearLayers() | 清空标注图层。 |
## 事件
| 事件名称 | 用法描述 |
| ------------ | ------------------------------------------------------------ |
| clusterclick | `markers.on('clusterclick',function(a){// a.layer 为聚合图对象 console.log('cluster '+ a.layer.getAllChildMarkers().length);});` |